UserCentriCities Benchmarking Dashboard
What is it?
Local governments are pivotal in delivering digital government services, often serving as the primary interface between citizens and digital offerings. However, their role in adopting user-centric principles, design thinking, and collaborative creation is often underappreciated, leaving them without essential tools for large-scale user-centric implementation.
To champion digital transformation centred on user needs, UserCentriCities has introduced a benchmarking dashboard. This tool, crafted collaboratively with project partners, offers an innovative and interactive means to assess service delivery and internal processes of local administrations across different sectors.
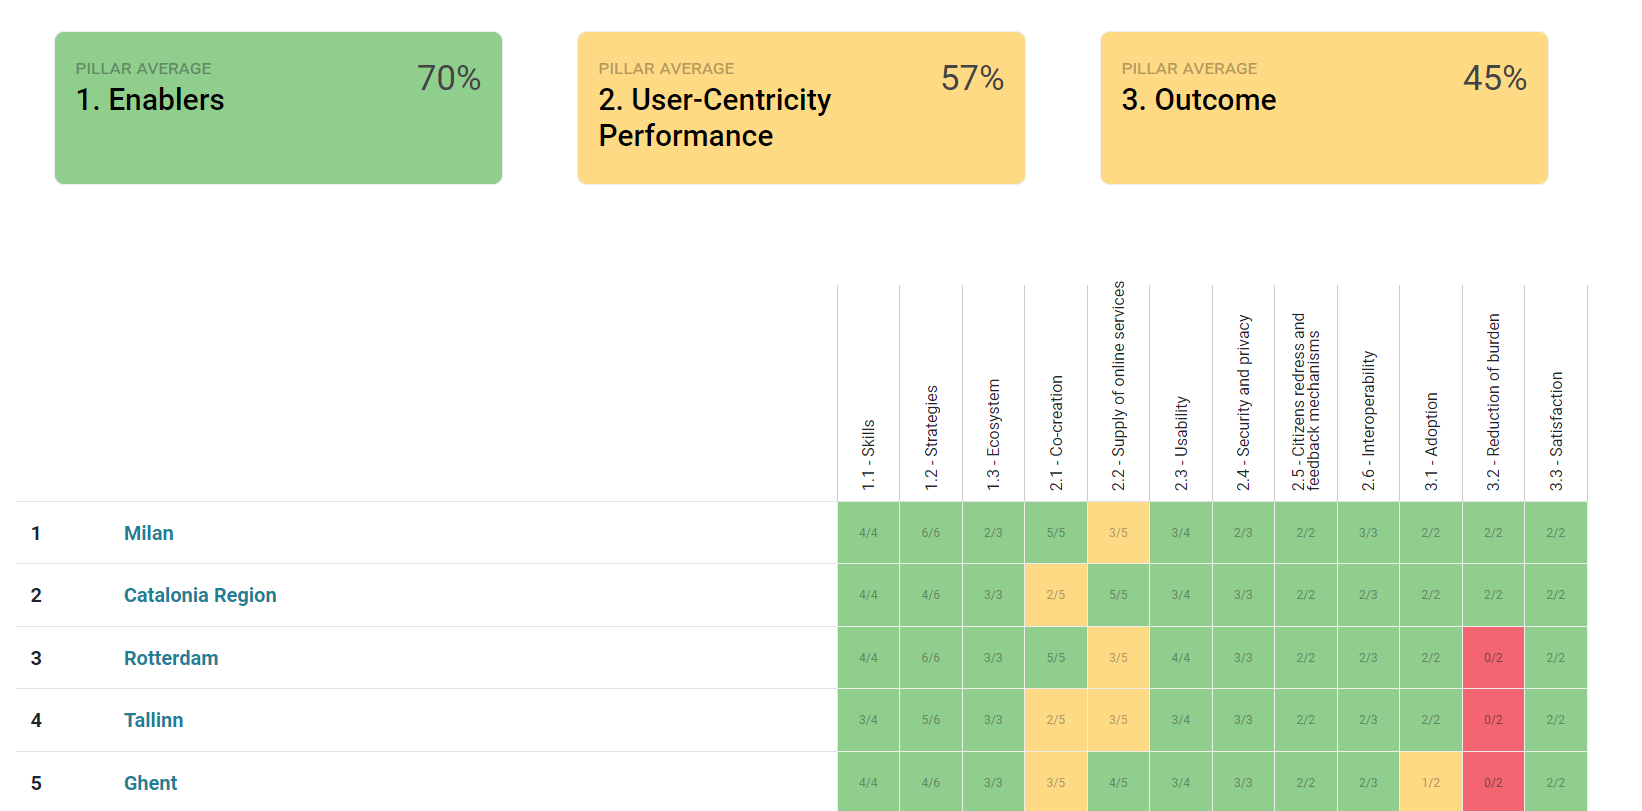
The dashboard is structured around three main pillars:
- Enablers: This encompasses skills, strategies, and ecosystems.
- Performance: This evaluates co-creation, service provision, usability, security, privacy, readiness, and adoption.
- Outcomes: This focuses on the tangible results, including reducing administrative hassles, enhancing citizen satisfaction, and minimising environmental impact.
For more details on specific indicators and what type of evidence is expected, users can consult the UserCentriCities Dashboard Guidelines manual.
Who is it for?
The Benchmarking Dashboard is open to all European cities and regions interested in assessing their user-centricity performance and service delivery to input their data. The administrations participating in the Dashboard will be featured in The 2023 State of UserCentriCities, the final report planned to be launched in Spring 2023, showcasing and analysing in-depth the level of user-centricity implementation across Europe at the local and regional level.
Directly from the developer’s website
Are you a digital solution provider? Be visible to the NEB community now!
Learn more